I wanted to practice creating custom Sentinel tables/logs and decided to try importing Zeek logs.
My test logs shall be generated using PCAP from malware-traffic-analysis.net.
Pre-requisites if you want to follow along:
- Azure account/tenant with a Log Analytics workspace and Sentinel instance; I set up a dedicated resource group to contain everything for easily clean up
- Azure Data collection endpoint within the same resource group; very straighforward to create
- Linux VM in Azure (I used Debian 12) with Zeek installed, as well as some other non-standard packages:
sudo apt install wget unzip python3-pandas
Getting Zeek Logs Nice And Ready
### my current working dir is /home/azureuser ###

mkdir testlogs && cd testlogs #zeek will fill up whatever folder you're in with logs

wget https://malware-traffic-analysis.net/2025/06/13/2025-06-13-traffic-analysis-exercise.pcap.zip

unzip 2025-06-13-traffic-analysis-exercise.pcap.zip #password: infected_20250613

zeek -Cr 2025-06-13-traffic-analysis-exercise.pcap LogAscii::use_json=T
After running the commands above, we should have a directory (/home/azureuser/testlogs) containing a pcap and a bunch of Zeek log files. For this test I was focused on just conn.log; the same procedure would need to be done individually for each type of Zeek log as the fields vary in each one. The Zeek command used reads in from a pcap and outputs using JSONL format; this is a format where each line is a separate JSON object. This is also the format that Data Collection Rules (DCR) like to ingest, but Azure doesn’t make that obvious.
As I’ll go over later, Azure Portal’s GUI for building custom tables/DCR is very sub-par. In particular, when creating a custom table, it asks for a sample JSON file to create the table schema. However, if you upload a JSONL log, IT DOESN’T WORK (at least the 1,000 times I tried to). Then when I ran into issues later, I found this Microsoft learn page that says DCRs expect logs in JSONL format. To summarize, you can’t use a JSONL log to create the table schema, but you MUST use JSONL logs when ingesting data. This is very cringe on Microsoft’s part.
Anyhow, I came across some additional log massaging that needed to be done so I created this Python script:
import pandas as pd

df = pd.read_json('conn.log', lines=True) # reads conn.log into a pandas dataframe; specify "lines=True" because it's in JSONL format
df['timestamp'] = pd.to_datetime(df['ts'], unit='s') # creates a new column which converts Zeek's epoch time 'ts' column to a readable format
df.drop(columns=['ts'], inplace=True) # drop ugly epoch time
df.rename(columns={
	'id.orig_h':'orig_h',
	'id.resp_h':'resp_h',
	'id.orig_p':'orig_p',
	'id.resp_p':'resp_p'}, inplace=True) # renames some columns that Azure doesn't like; you can do this within the DCR using a transform, either way works
df.to_json('conn.log.json', orient='records', lines=True)
df.to_json('conn.log2.json', orient='records')
A note on that last line; just for the purposes of creating the schema using the GUI, I created another log that isn’t in JSONL format. This wouldn’t be needed other than defining the table.
Creating a Custom Table in Log Analytics Workspace
The ingestion pipeline I’m setting up is described on the Microsoft Learn page linked here.
Within my log analytics workspace, I select Settings -> Tables -> Create -> New custom log (Direct Ingest)
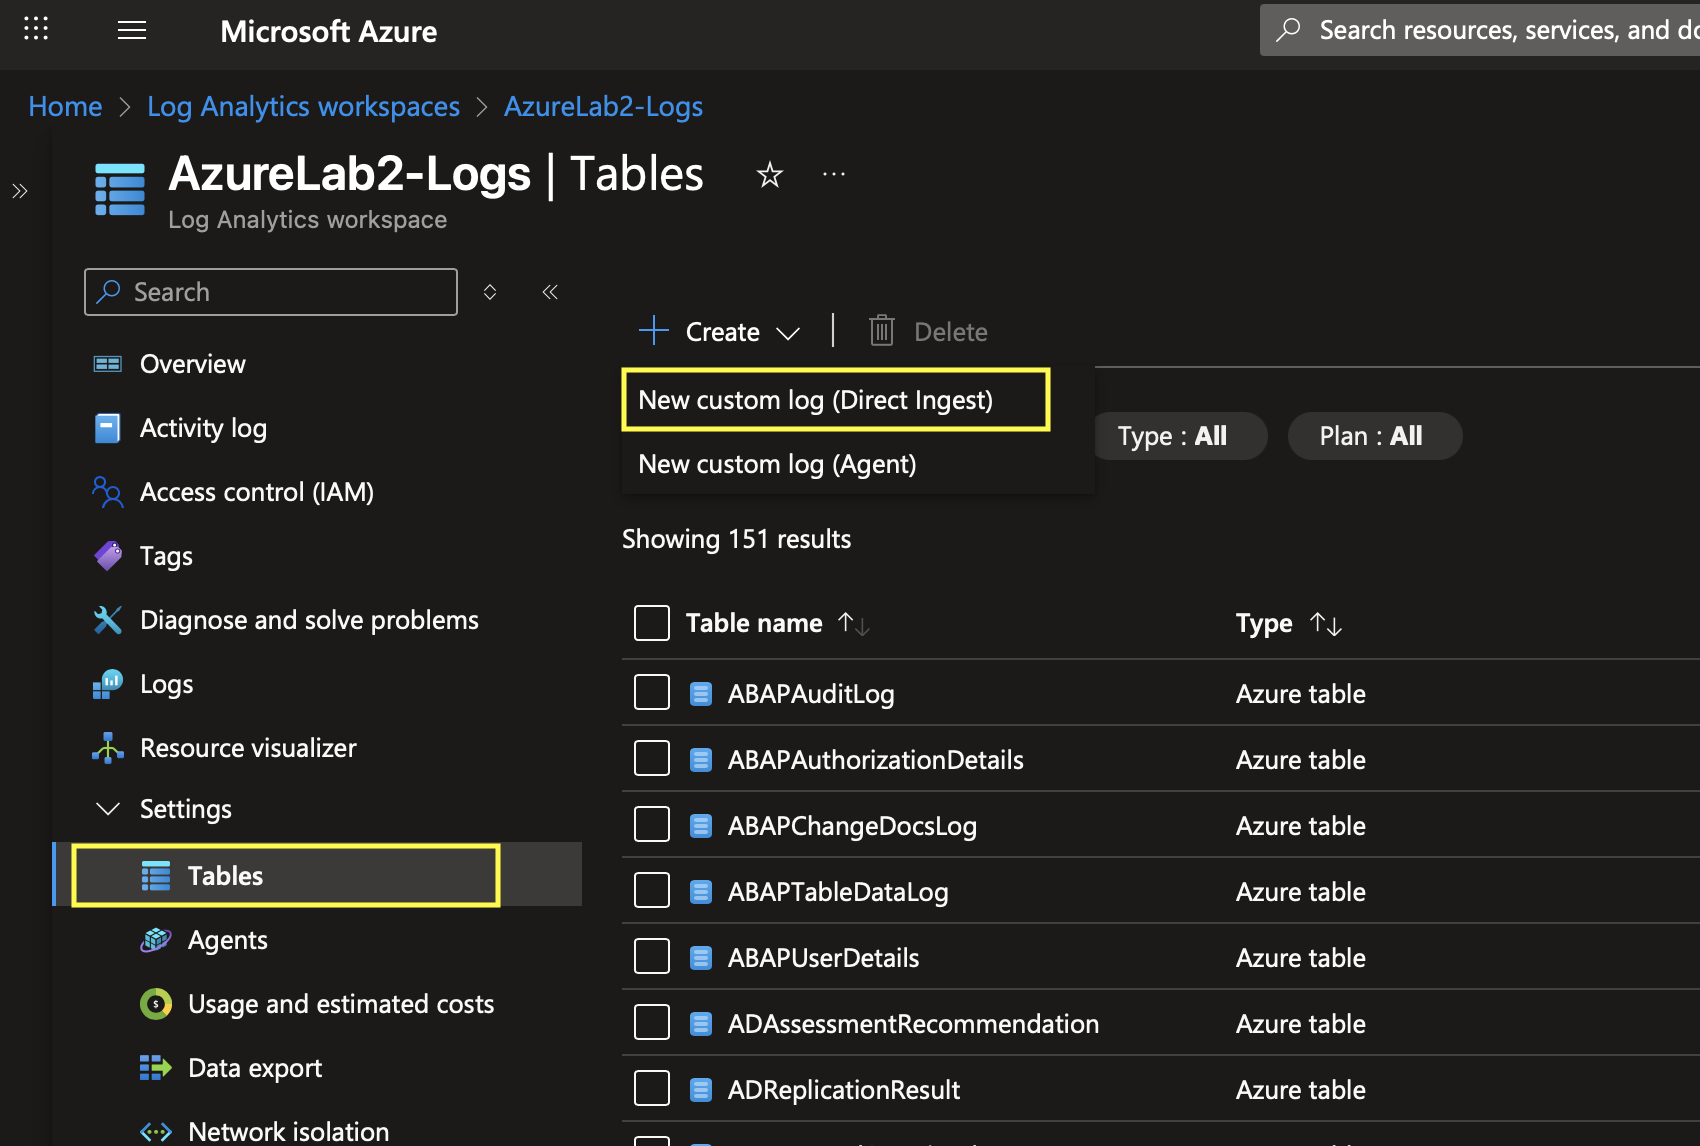
In the GUI that opens I gave the table a name, selected “Analytics” plan, created a new Data Collection Rule (I edit this some more later), and select the Data Collection Endpoint I’d already created.
I upload the “conn.log2.json” I created earlier. As a reminder this is the sample I created that is not in “lines” format, but this upload page won’t take the properly formatted version. It takes the log and generates the schema. Note that “TimeGenerated” is a required field; if it is not present in the data, Azure adjusts the transformation to populate the field with time of ingestion. If it doesn’t automatically do this, you can add it yourself:
source | extend TimeGenerated = now()
After clicking “Next” and “Create”, the table is created!
Polishing up the DCR
Recall that the first page of the table creation wizard had me create a data collection rule. At this point, I went to go edit this rule to add my linux VM for data collection. I navigate to Data Collection Rules using the Azure search bar, select my DCR, and add a resource like so: ![[static/dcr_resource_add.png]]
This brings up a menu of my Azure resources. After selecting the dropdowns and checking the box next to the VM where my logs are, I select apply:
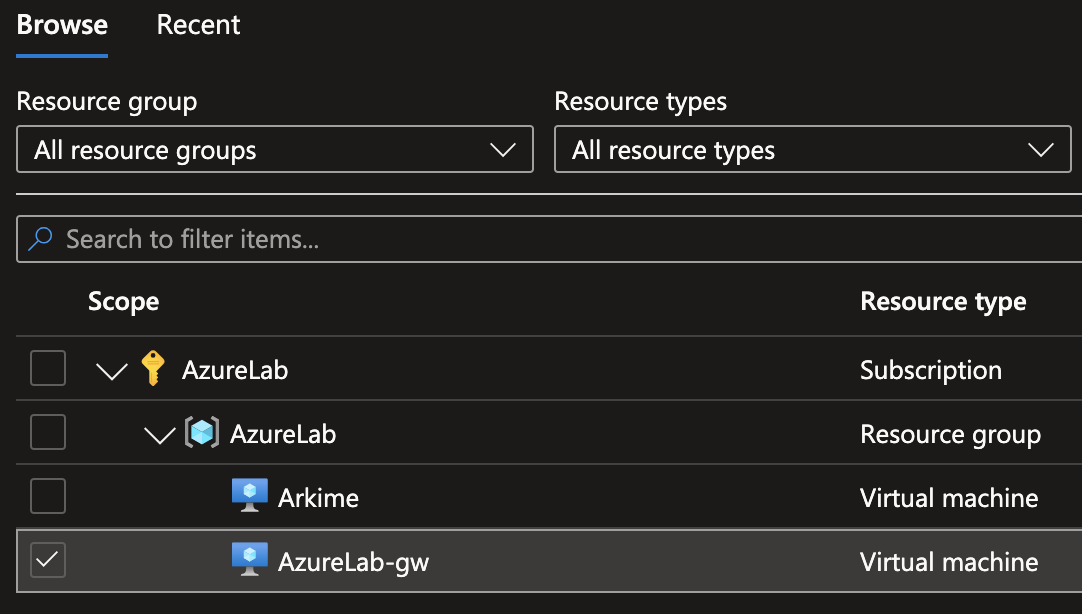
As soon as I do this, I see some notifications that the Azure Monitor Agent (AMA) is being installed on the selected VM.
Now here is something annoying: the way this DCR was created via the custom table creation wizard, there doesn’t seem to be a way to specify log filepath/pattern for the Azure Monitor Agent to know where to collect the logs. At least, the method to do this seems to be editing the default data source that was created, but this would require manually redefining the log’s schema. It’s all kind of silly. It seems the easier way, but still kind of annoying, is to redeploy the DCR, editing the JSON configuration. The process is explained well in Microsoft Learn at this link.
The portion of the template I had to edit was "dataSources": {}, which became:
"dataSources": {
	"logFiles": [
		{
			"streams": [
				"Custom-Zeek_Conn_CL"
			],
			"filePatterns": [
				"/home/azureuser/testlogs/conn.log*.json"
			],
			"format": "json",
			"name": "ConnJson"
		}
	]
},
After saving, I keep the name of the DCR the same and create it. This overwrites the existing one.
Conclusion
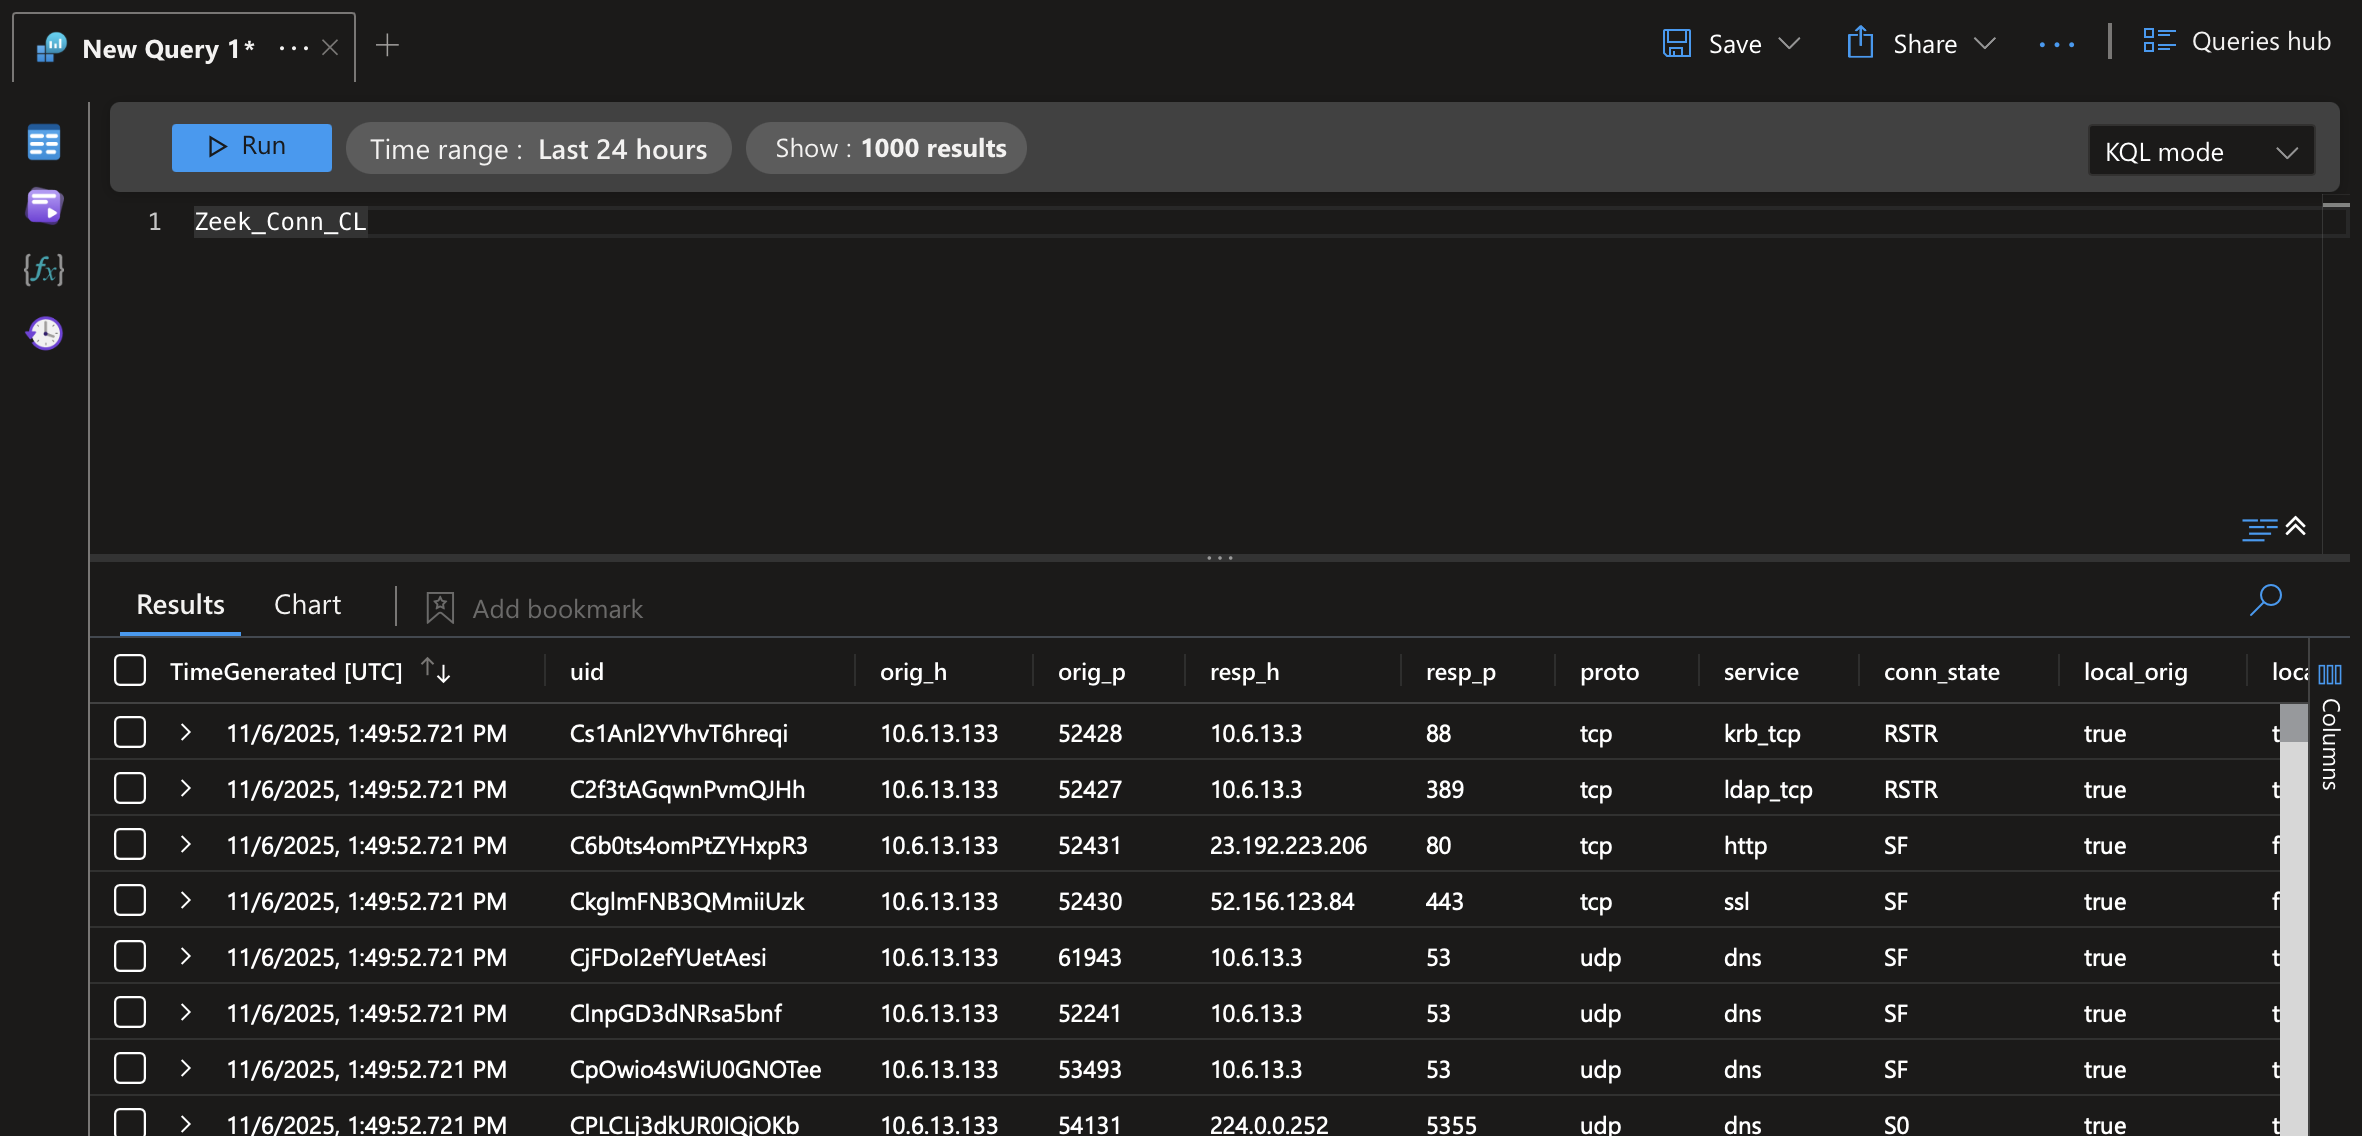
That was it. With the properly formatted conn.log.json in the target directory defined within the “dataSources”/“filePatterns” section, the Azure Monitor Agent will scoop up the log and send it to the custom table. Here’s what it looks like querying the custom table:
I found it useful to view the “Metrics” page within the DCR to see if it has successfully started ingesting logs. Just go to “Metrics” and select something in the Metric dropdown like “Logs Ingestion Bytes per Min”. Also, you can send DCR errors to a “DCRLogErrors” table in your workspace by going to “Diagnostic settings” -> “Add diagnostic setting” -> “Log Errors” -> “Send to Log Analytics Workspace”. This might help troubleshooting when you run into issues.
In the future I’d like to avoid the GUI if possible. It has stupid bugs like the JSON upload thing, as well as requiring the template deployment to add a filepath to the datasource. I believe it will be more straightforward to use powershell to deploy all these resources in my tenant.
Additionally, it will be fun to enhance Zeek logs using scripting and Pandas to add columns with useful security context. Might do so in a subsequent blog.